a whole landscape of expression profiling in human brains for six neuropsychiatric disorders
a whole landscape of expression profiling in human brains for six neuropsychiatric disorders
Our study totally collected 8317 samples from 48 datasets on microarrays or RNA-seq platforms. It contains 427 SCZs, 312 BDs, 219 MDDs, 53 ASDs, 765 ADs, 163 PDs and 6378 healthy controls (not neuropsychiatric-affected).

The data pre-processing workflow for each individual dataset of microarray platforms is uniform. After we received the normal human brain gene expression raw data (.CEL files), we first removed the non-brain samples according to the sample clinical information. Then, we filtered the samples with a detection P value above 0.06 in at least 80 % probes. We processed the CEL files using standard tools available within the affy package in R. The CEL files were processed with the expression command to convert the raw probe intensities to probeset expression values. We used the CLL, CLLbatch, simpleaffy packages to obtain the quality control results of samples and filtered the poor quality samples. After that, we used the impute package in R to impute the NA values in the dataset. Then we used gene-based expression values to replace the probe-based values. In the case of multi-probe-per-gene, we took the maxmean of the probe-based values as the representative values of the gene. After we logit transformed the data and corrected the batch information using ComBat.
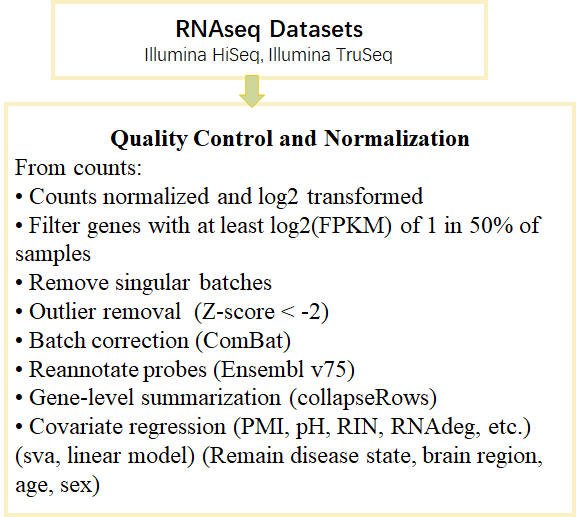
The data pre-processing workflow for each individual dataset of RNA-seq platforms is uniform. We processed the RNA-seq data from counts. We used gene-based expression values to replace the probe-based values. In the case of multi-probe-per-gene, we took the maxmean of the probe-based values as the representative values of the gene. After we logit transformed the data and corrected the batch information using ComBat.

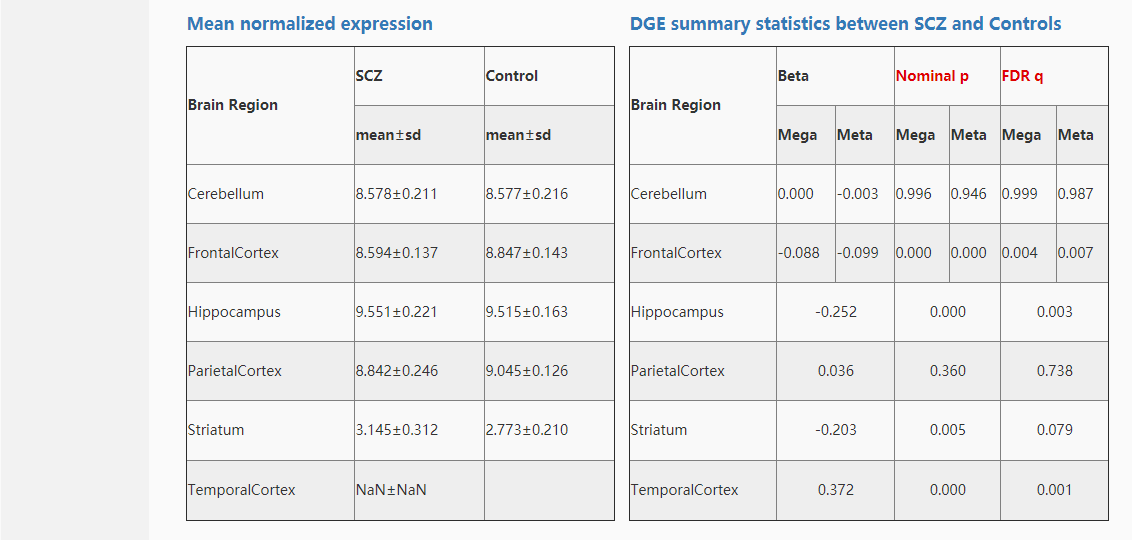
We did gene differential analysis between cases and controls on three dimensions (brain region, sex and age stage) using two methods (meta-analysis and mega-analysis).
For gene differential meta-analysis, linear mixed-effects model was used after covariates regressed to detect differentially expressed genes. For gene differential mega-analysis, ComBat was used to correct the batch effect among different datasets after covariates regressed. And then limma was used to detect differentially expressed genes.
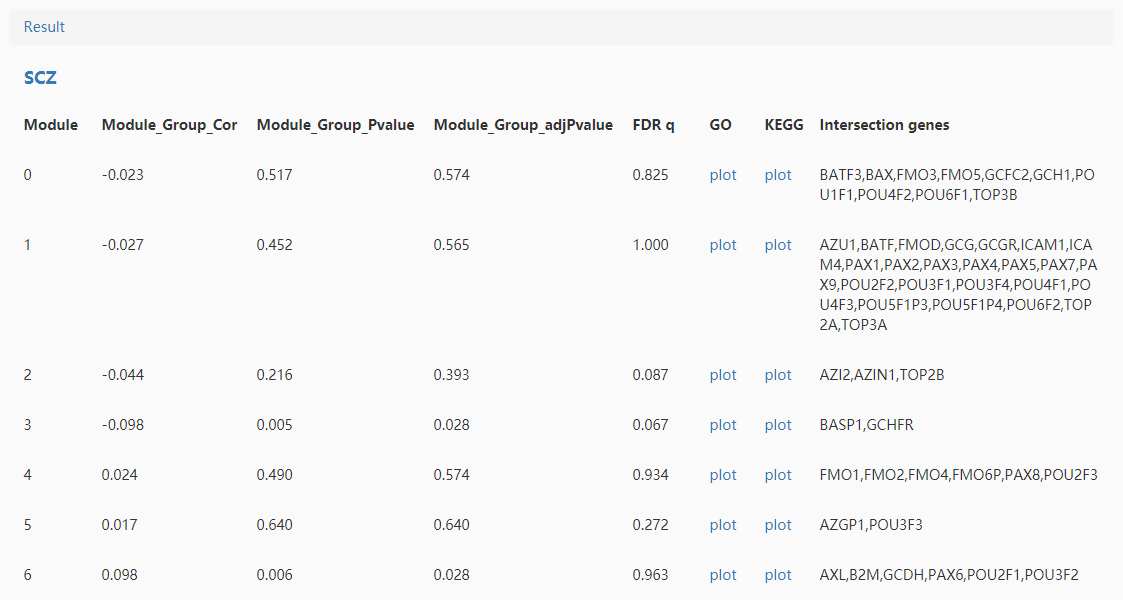
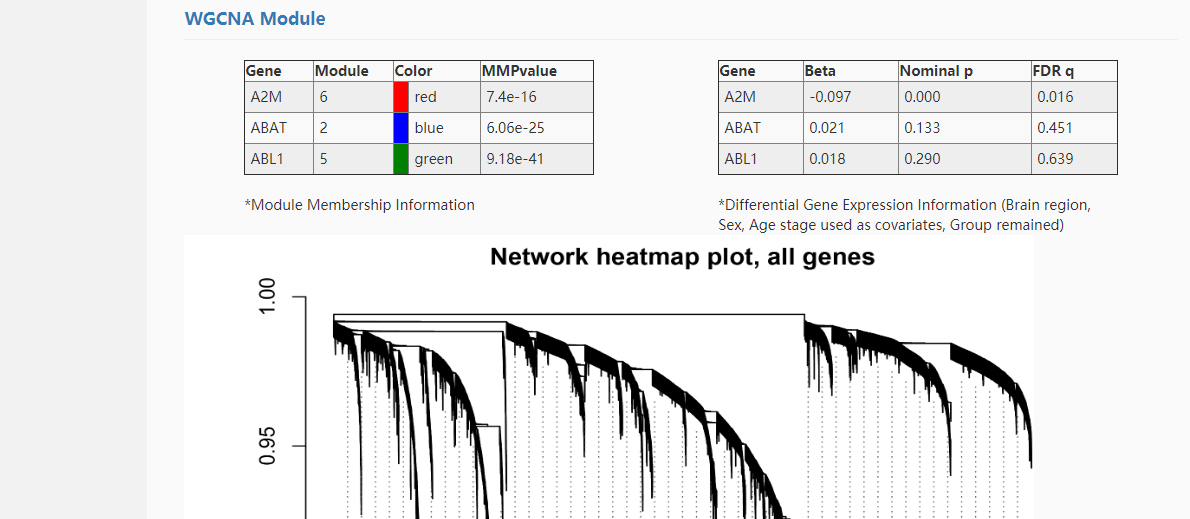
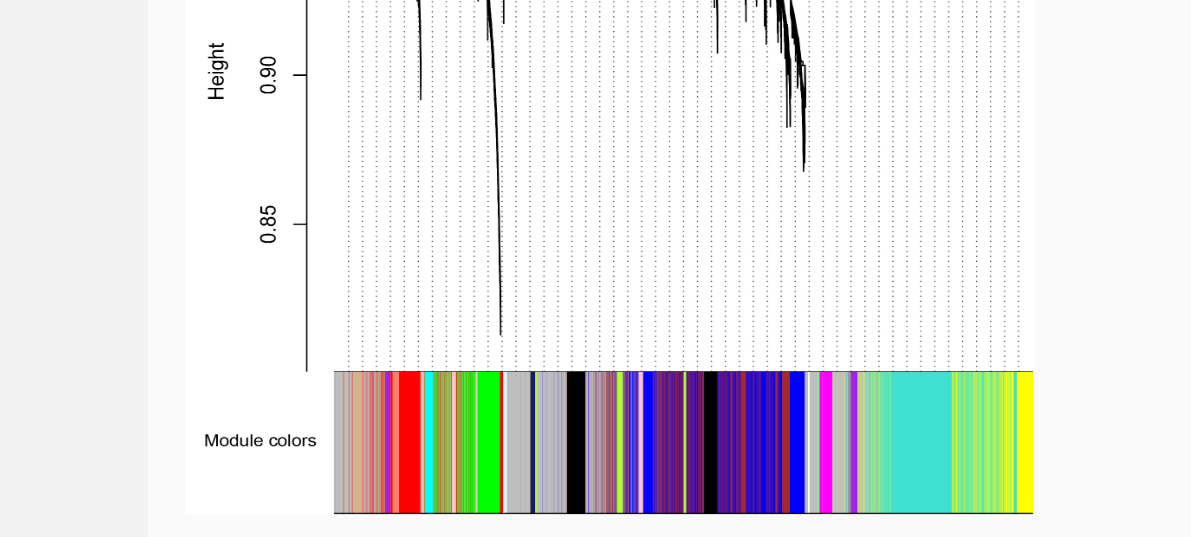
WGCNA (Weighted Gene Co-expression Network Analysis) was used for gene co-expression network analysis. Spearman correlation analysis was used to detect disease-related modules.
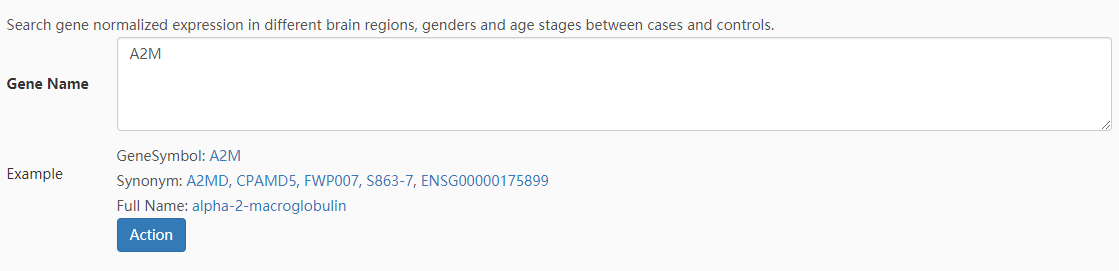
We took the gene DRD2 for example. First, input "DRD2" in the gene differential expression search box and submit it, then the search results were shown as follows:

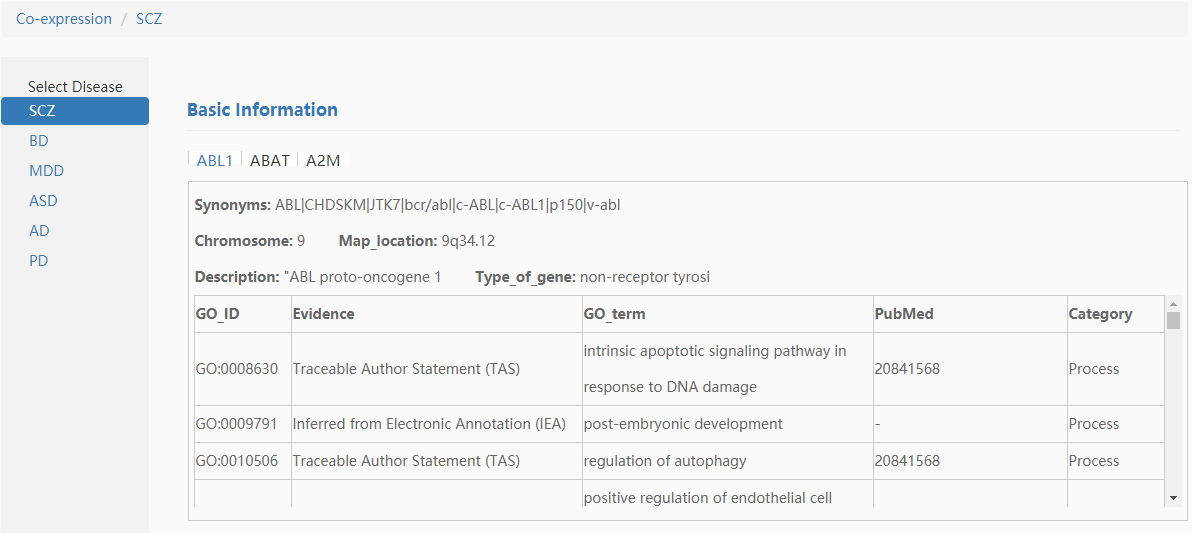
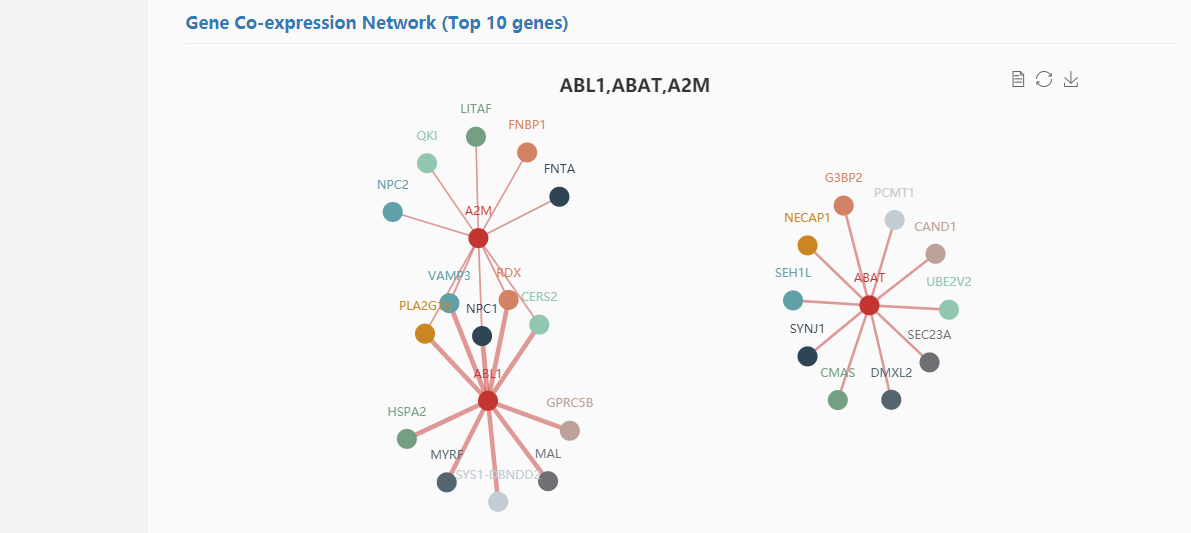
We took the genes ABL1,ABAT,A2M for example. First, input "ABL1,ABAT,A2M" in the gene co-expression search box and submit it, then the search results were shown as follows:

Simplely click the "Example" and select disease(s) which you want enrich, then you can submit it and the analysis results were shown as follows(part):

Module_Group means the correlation test between module and disease state.